使用熊猫处理数据库
对保存在 SQL 中的数据执行各种操作可能会导致执行非常复杂的查询,而且不容易编写。因此,为了使这项任务变得更容易,使用熊猫来做这项工作通常是有用的,熊猫是专门为数据预处理而构建的,比 SQL 更简单和用户友好。
有时数据存储在 SQL 中,我们希望用 python 从 SQL 中获取数据,然后使用 pandas 执行操作,这种情况可能会出现。让我们看看如何使用熊猫与 SQL 数据库进行交互。
这是我们将要处理的数据库 糖尿病_数据
注:假设我们把数据存储在 sqlite3 中
读取数据
# import the libraries
import sqlite3
import pandas as pd

# create a connection
con = sqlite3.connect('Diabetes.db')

# read data from SQL to pandas dataframe.
data = pd.read_sql_query('Select * from Diabetes;', con)

# show top 5 rows
data.head()
输出

基本操作
*** 行切片**
# read the data from sql to pandas dataframe.
data = pd.read_sql_query('Select * from Diabetes;', con)

# slicing the number of rows
df1 = data[10:15]
df1
输出

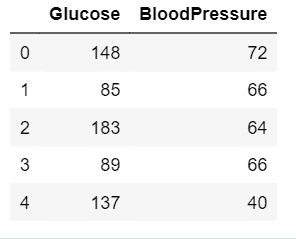
*** Selecting specific columns To select a particular column or to select number of columns from the dataframe for further processing of data.
```py
# read the data from sql to
# pandas dataframe.
data = pd.read_sql_query('Select * from Diabetes;', con)
# selecting specific columns.
df2 = data.loc[:, ['Glucose', 'BloodPressure']].head()
df2
```
**输出:**
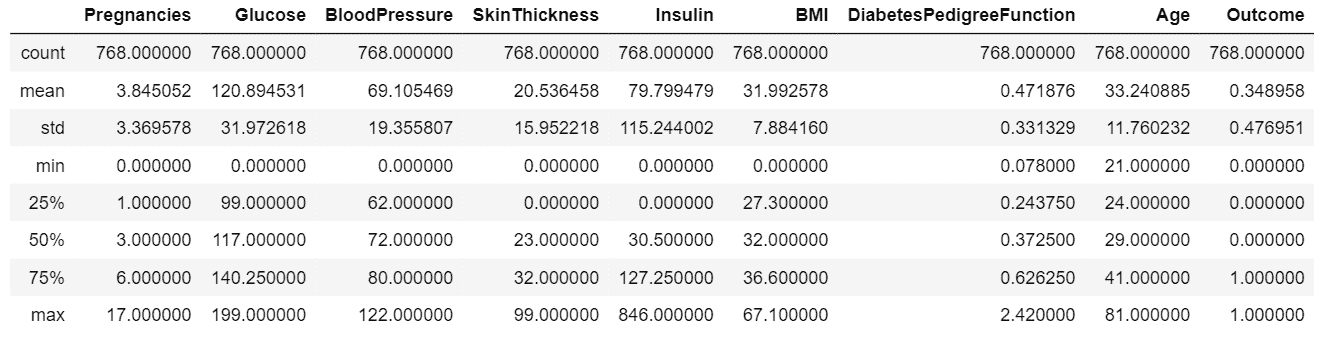
* **Summarize the data
In order to get insights from data, we must have a statistical summary of data. To display a statistical summary of the data such as mean, median, mode, std etc. We perform the following operation
```py
# read the data from sql
# to pandas dataframe.
data = pd.read_sql_query('Select * from Diabetes;', con)
# summarize the data
data.describe()
```
**输出:**
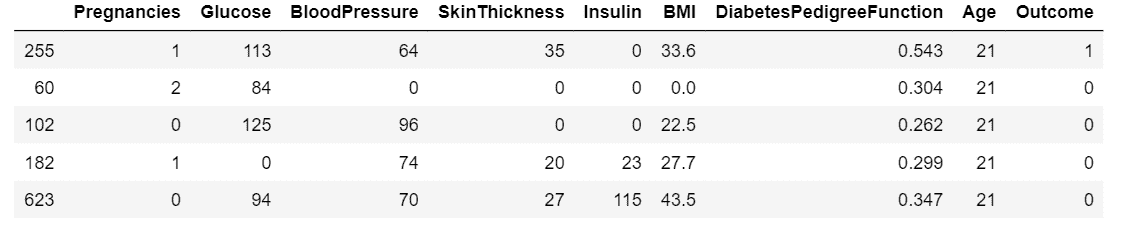
** * ****Sort data with respect to a column
For sorting the dataframe with respect to a given column values
```py
# read the data from sql
# to pandas dataframe.
data = pd.read_sql_query('Select * from Diabetes;', con)
# sort data with respect
# to particular column.
data.sort_values(by ='Age').head()
```
**输出:**
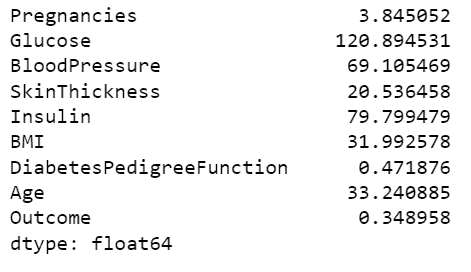
**** * ******Display mean of each column
To Display the mean of every column of the dataframe.
```py
# read the data from sql
# to pandas dataframe.
data = pd.read_sql_query('Select * from Diabetes;', con)
# count number of rows and columns
data.mean()
```
**输出:**
********
